Ideation
Envisioning
After the research and insights, we defined further the meaning and value we would like to introduce with our design.
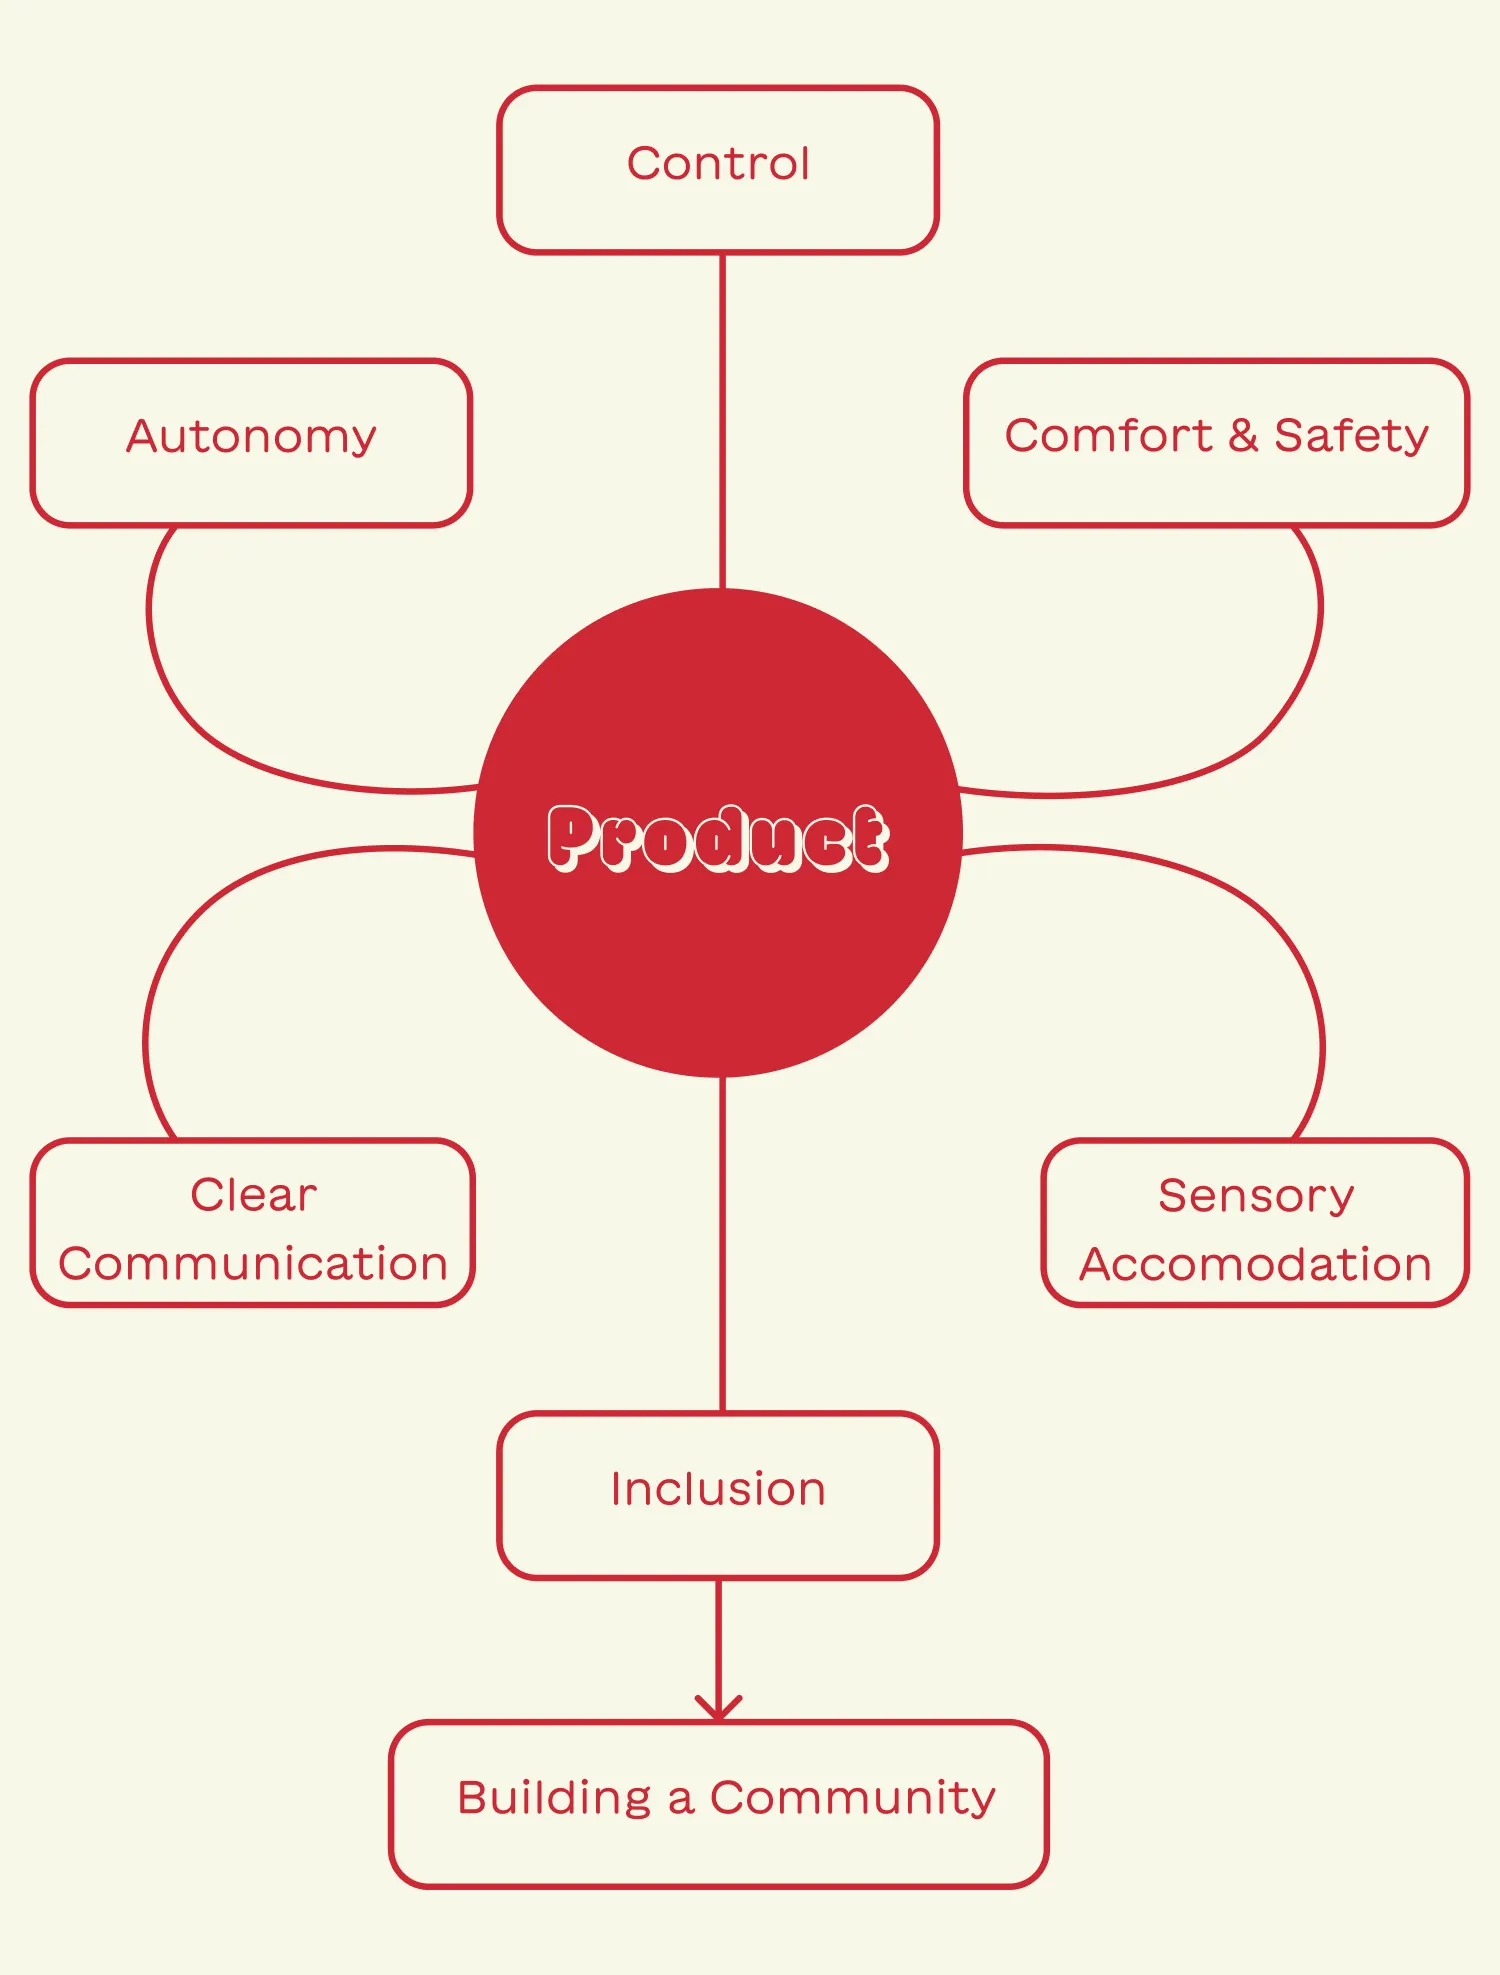 Fig. 2.1 – Value proposition
Autonomy: Provide the individuals with a sense of independence, nurturing self-confidence.
Control: Reduce unexpected events in one’s environment, matching individual’s expectations with the activities.
Comfort and Safety: Helping in giving a sense of well-being without the person feeling overwhelmed, and taking necessary measures for the individual to feel safe.
Clear Communication: Supportive and understanding in communicating all the facets of the experience with kind and clear language.
Sensory Accommodations: The product should consider sensory sensitivities.
Inclusion and Building a Community: Creating an environment where everyone feels welcomed, respected and provided with equal opportunities to participate and contribute. Embracing and valuing the diversity of all individuals, regardless of their abilities, backgrounds, diagnosis or characteristics. Inclusivity can promote a sense of belonging and acceptance.
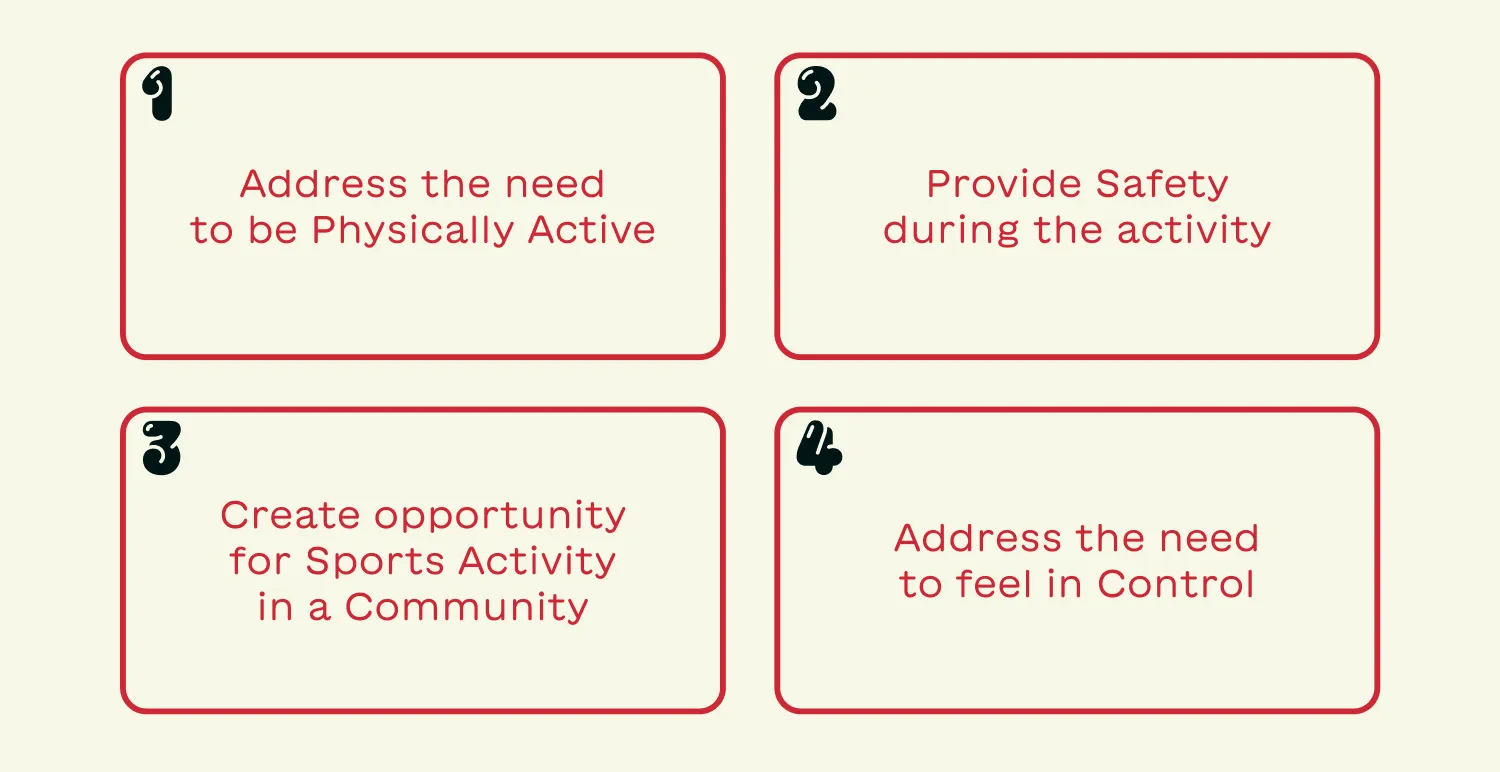 Fig 2.2 – Meanings introduced_
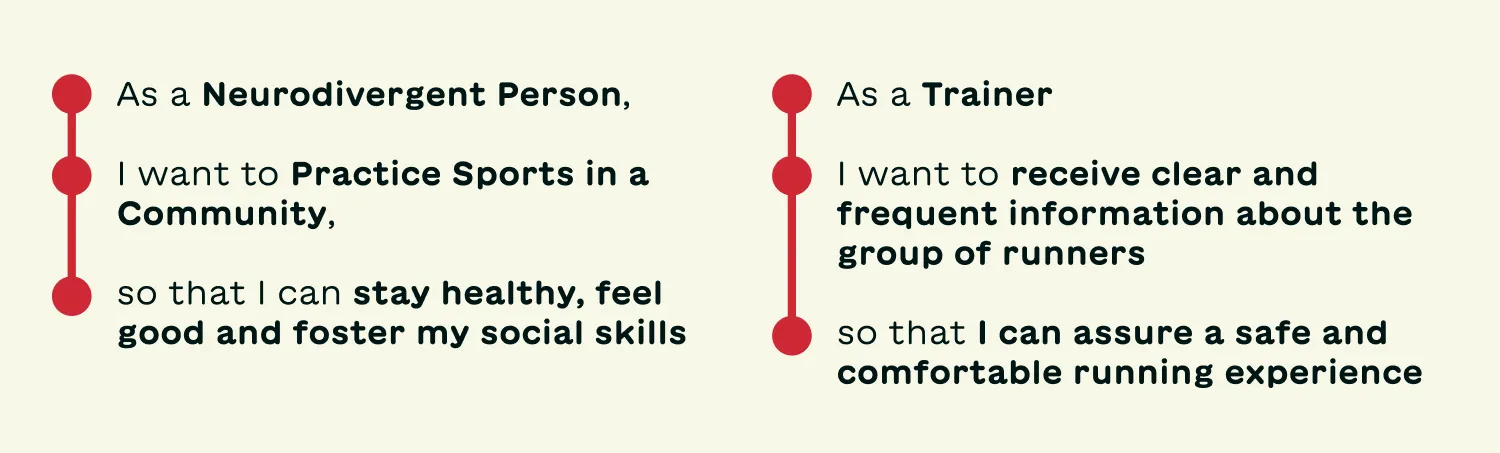 Fig 2.3 – Problem statements for runners and trainers
We have formed a palette of emotions that we believe our users might experience during their time in Run Challenge, ranging from the worst to the best. The best emotion in the chart is a utopic goal, which is not something all users have to achieve and just serves the purpose of representing the vision.
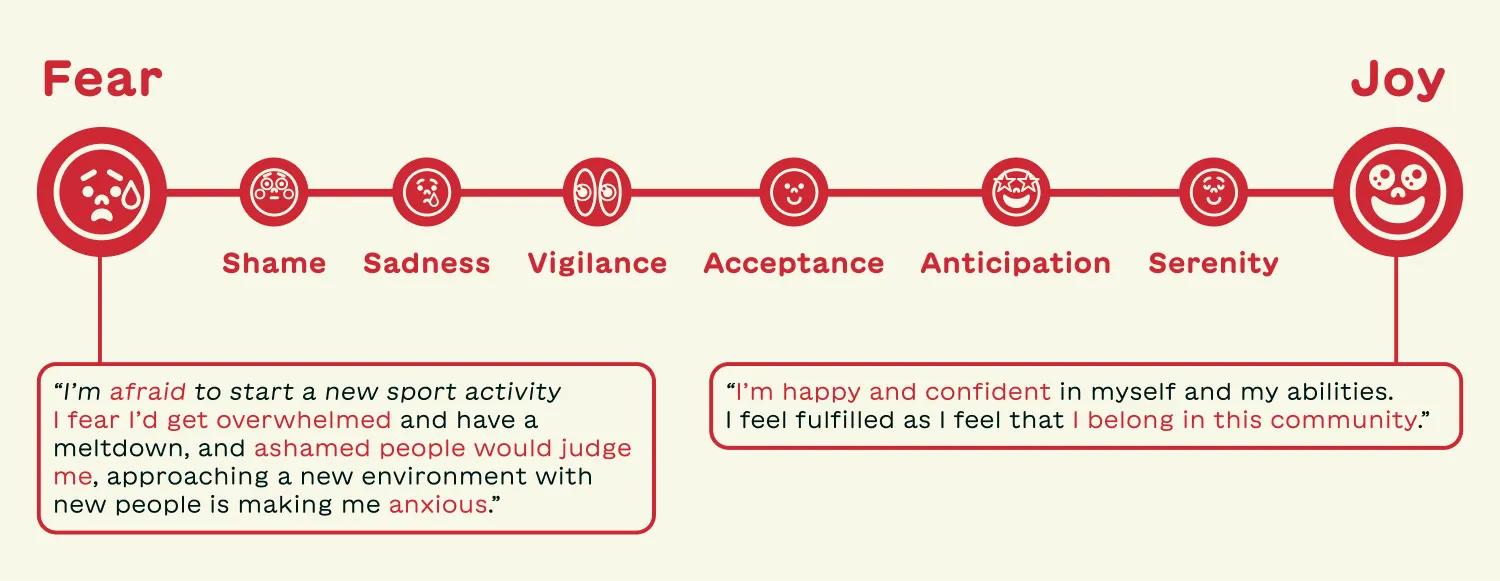 Fig 2.4 – Emotion gradient of the experience
Solution Sketches
Based on our observations from the first-hand experience and the value we wanted to introduce, we had group discussions, talking, writing and sketching. Eventually, we agreed upon 4 concept designs, which we pondered about further.

We received feedback regarding the first and second ideas being more useful and that we can combine them. However, through discussions, we realized integrating this technology into t-shirts, as stated in the second idea, would not be so feasible as the t-shirts would need to be washable. Instead, a smart band to be distributed to the runners can be a better option.
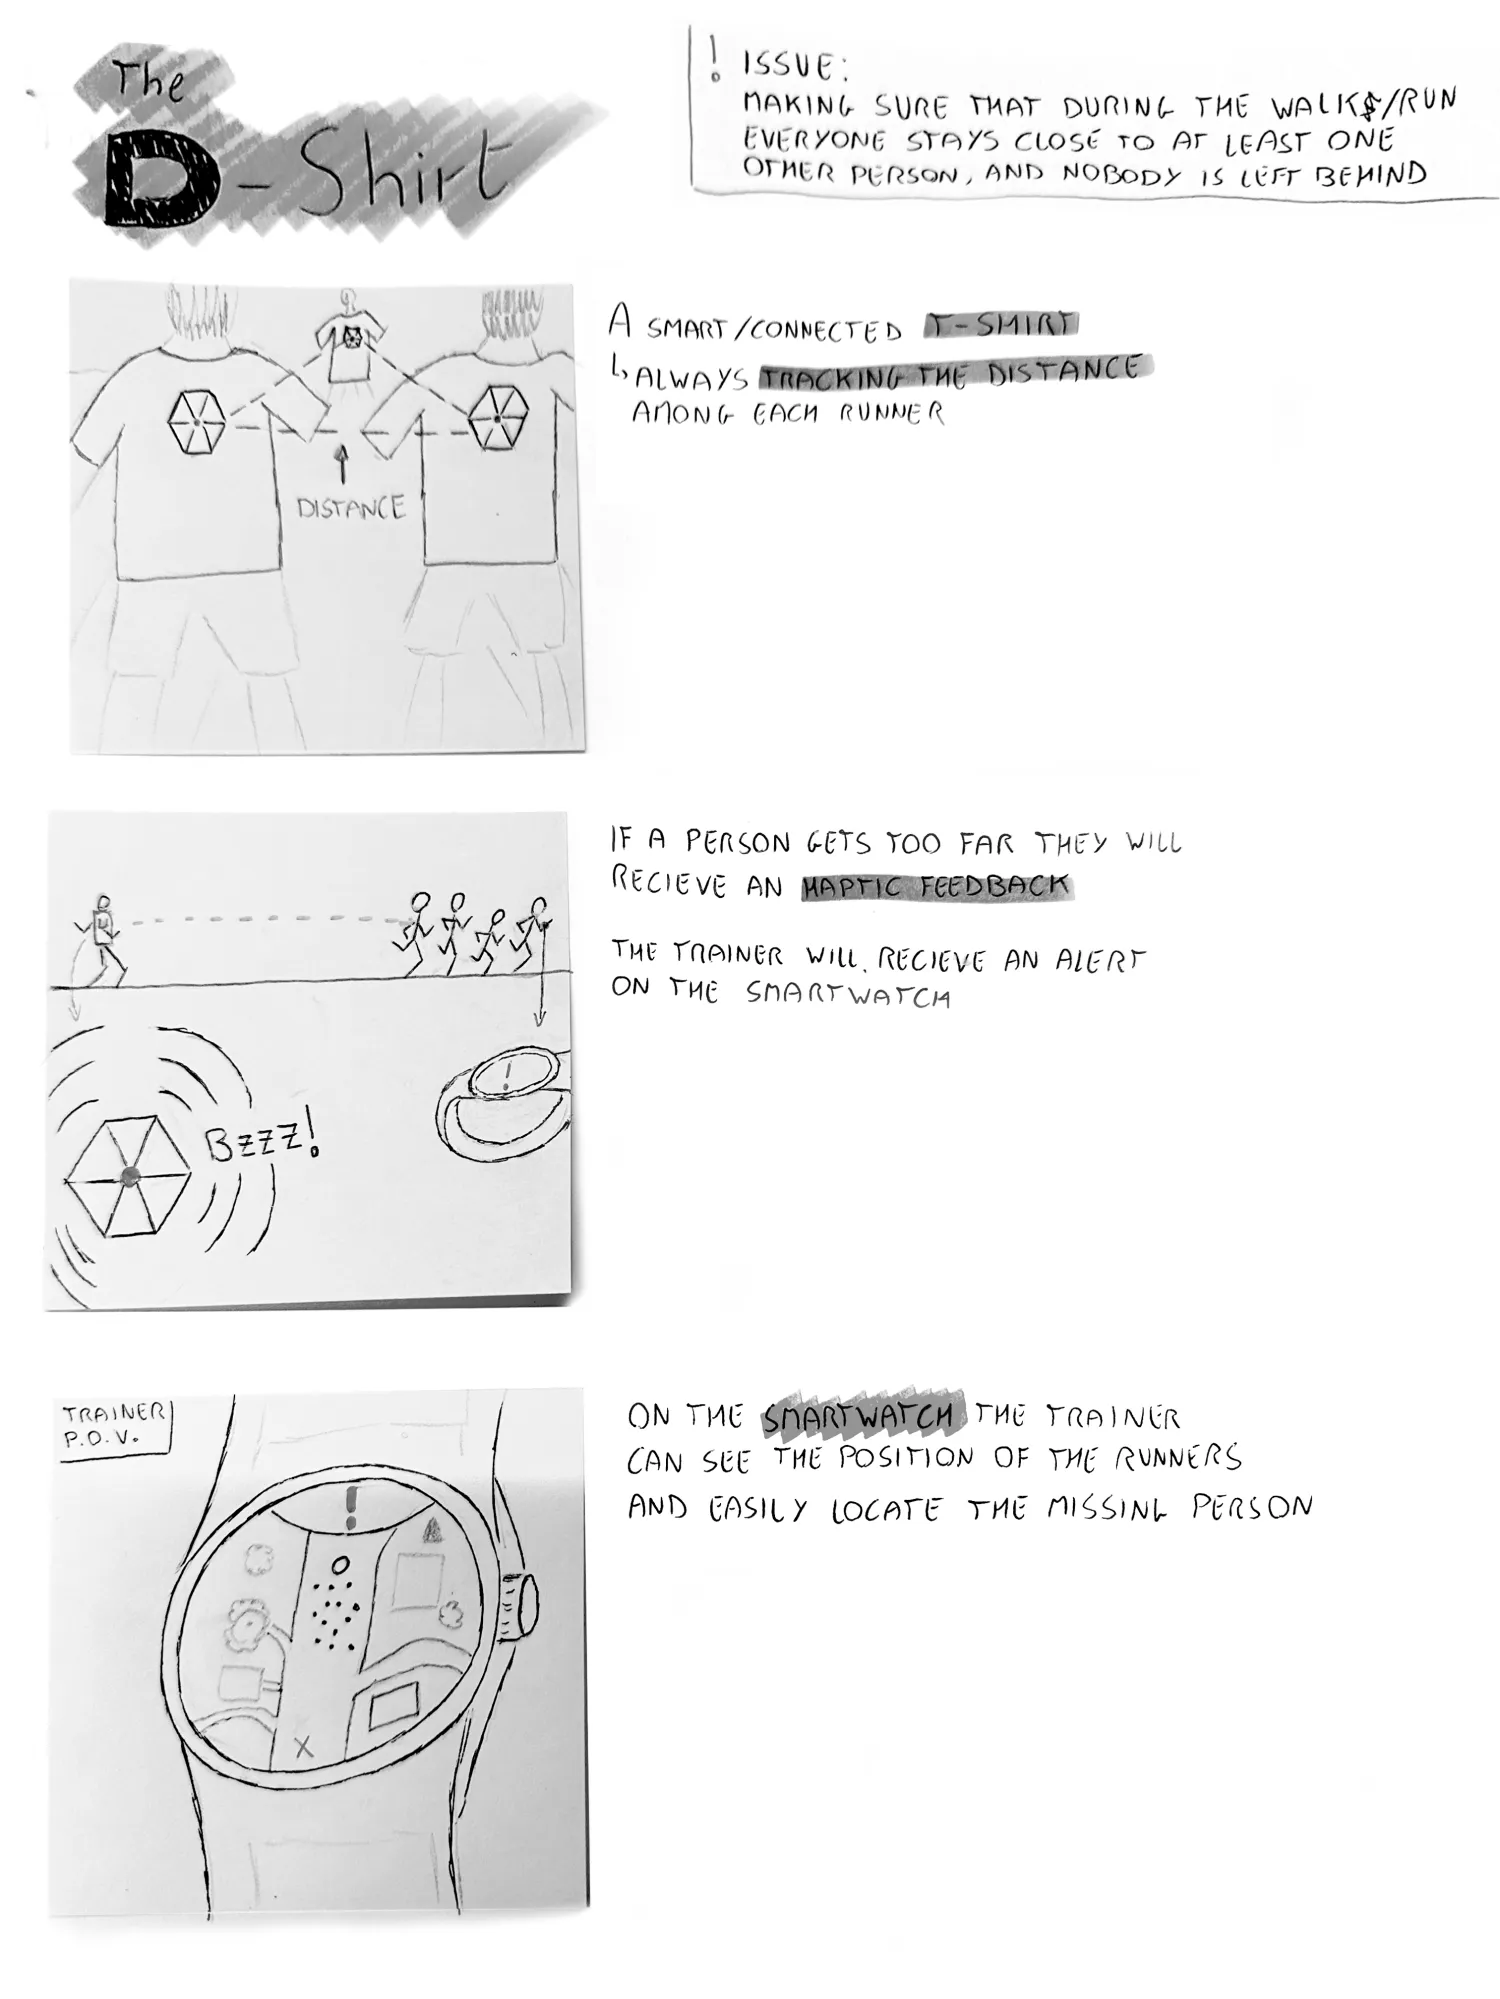
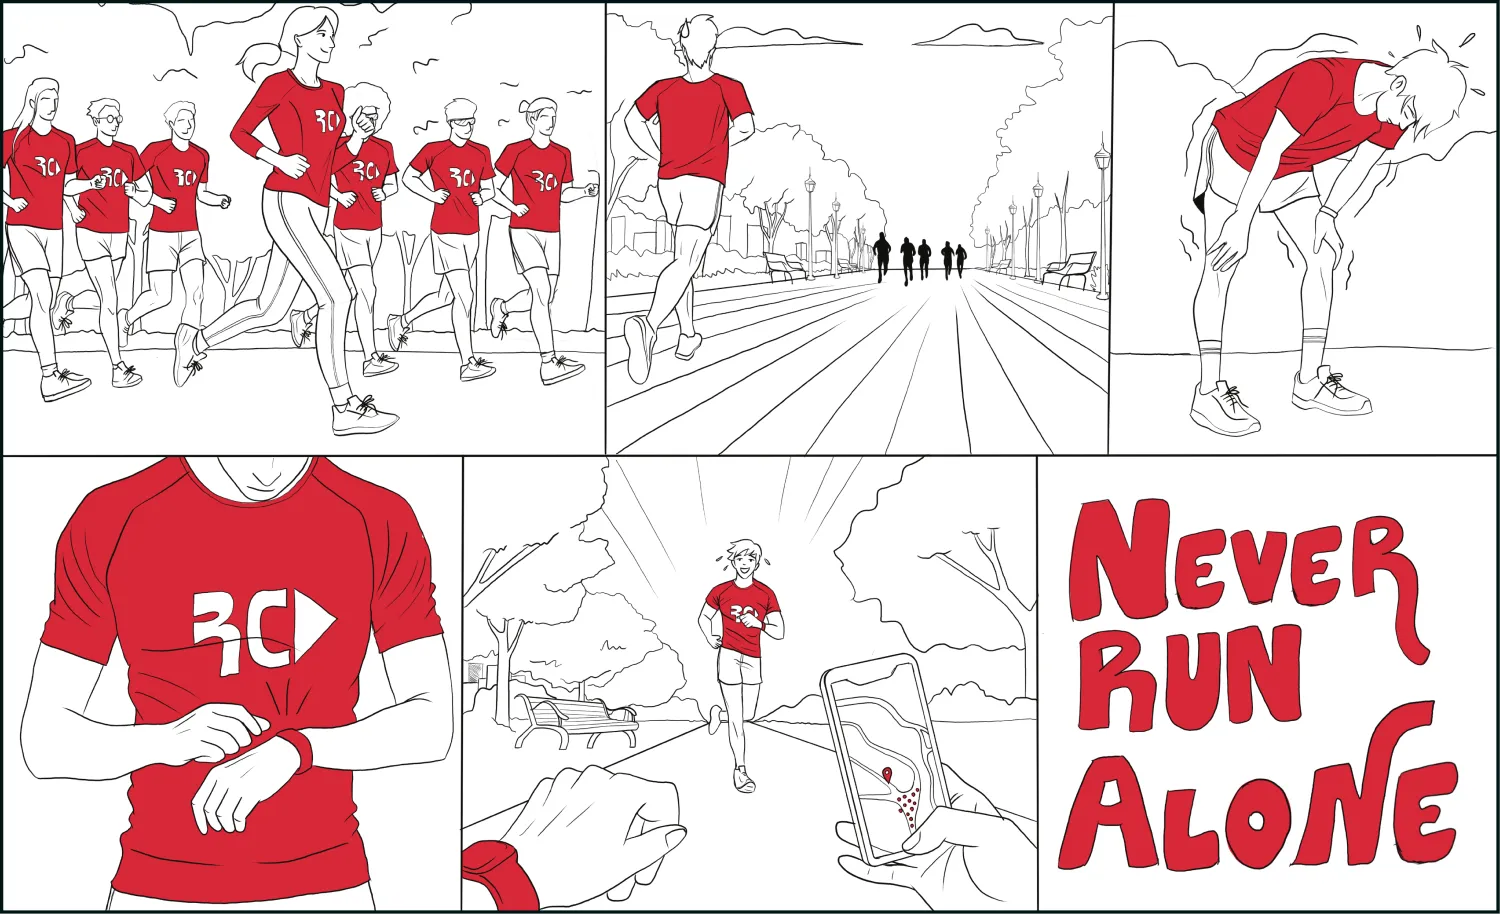
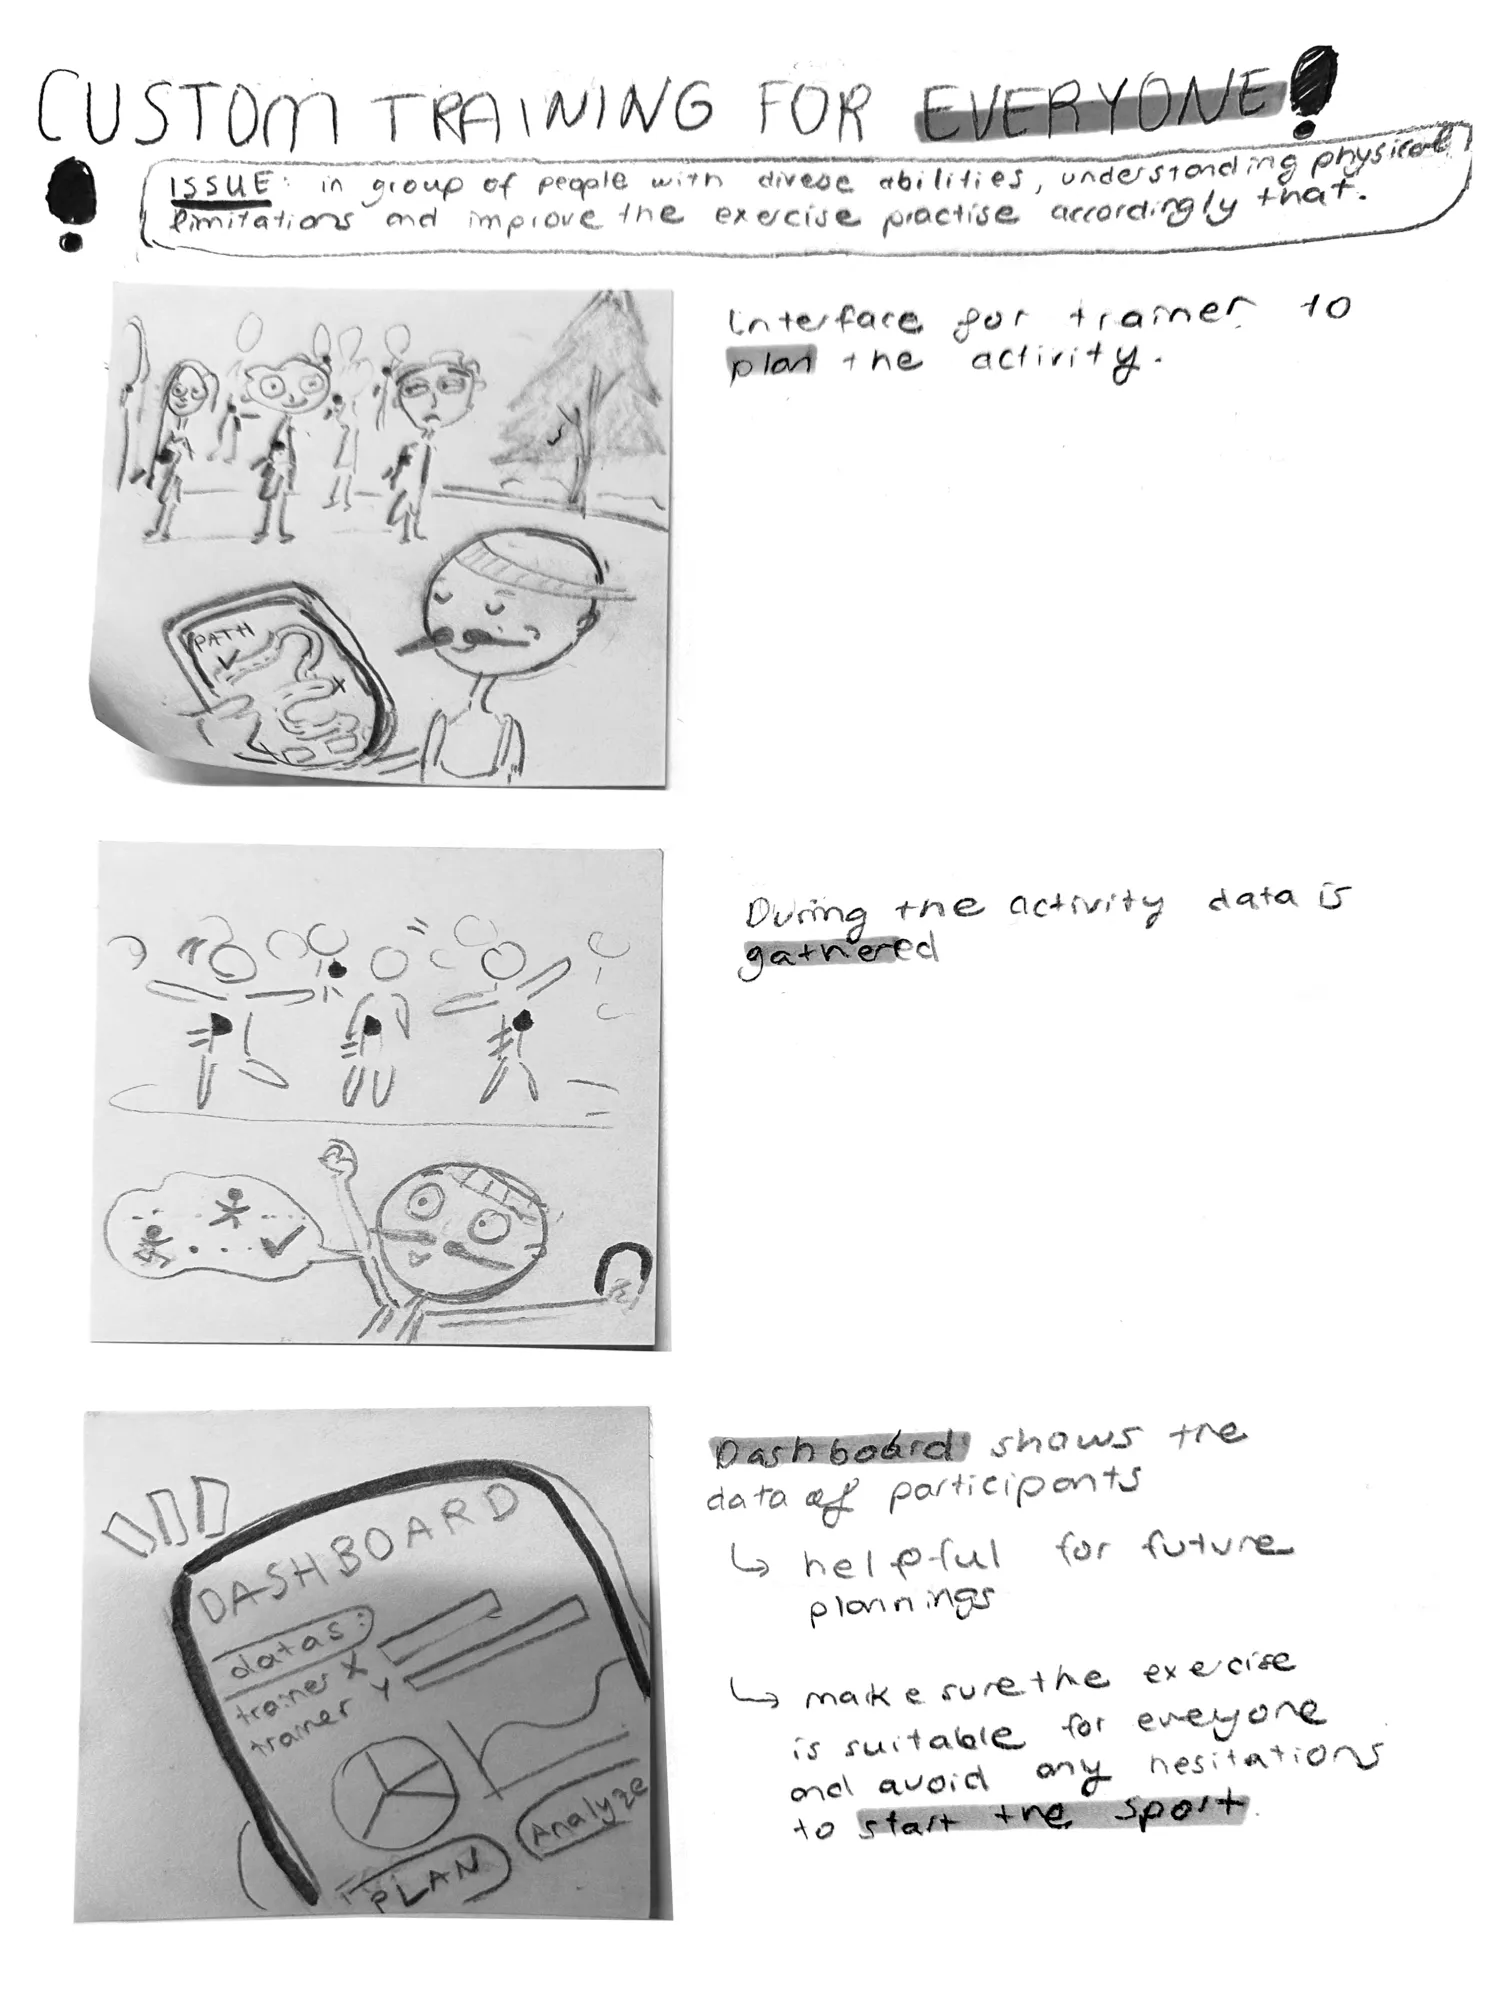
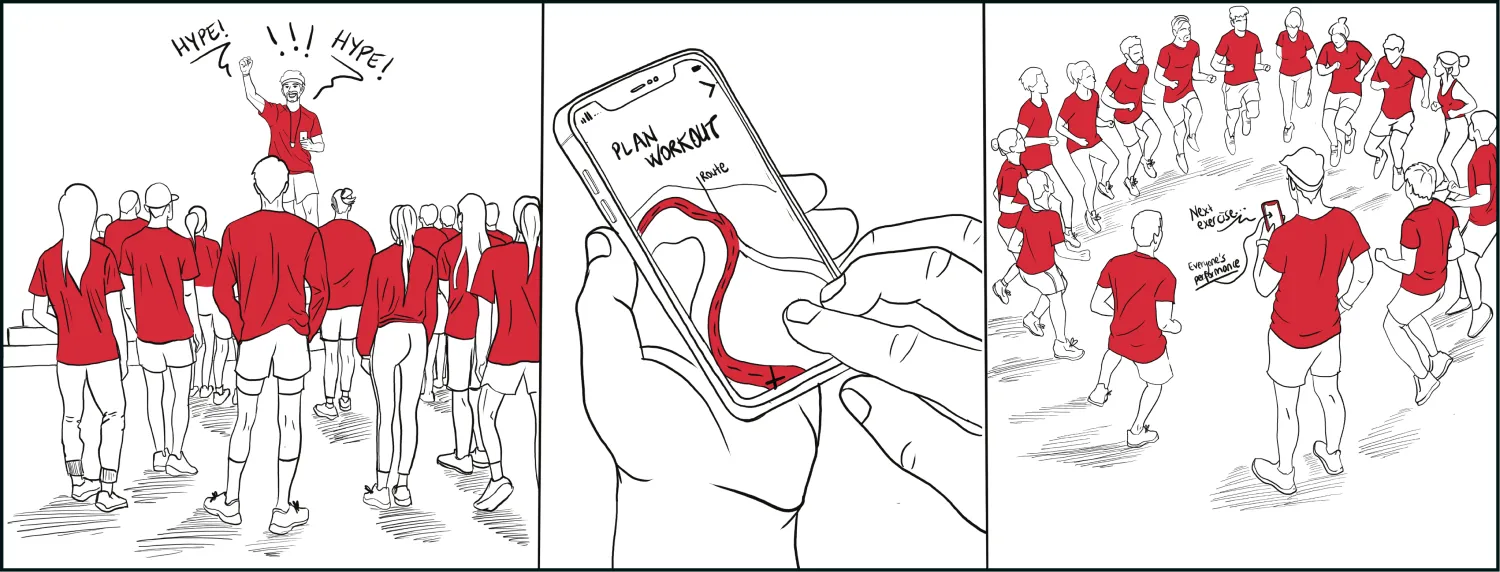
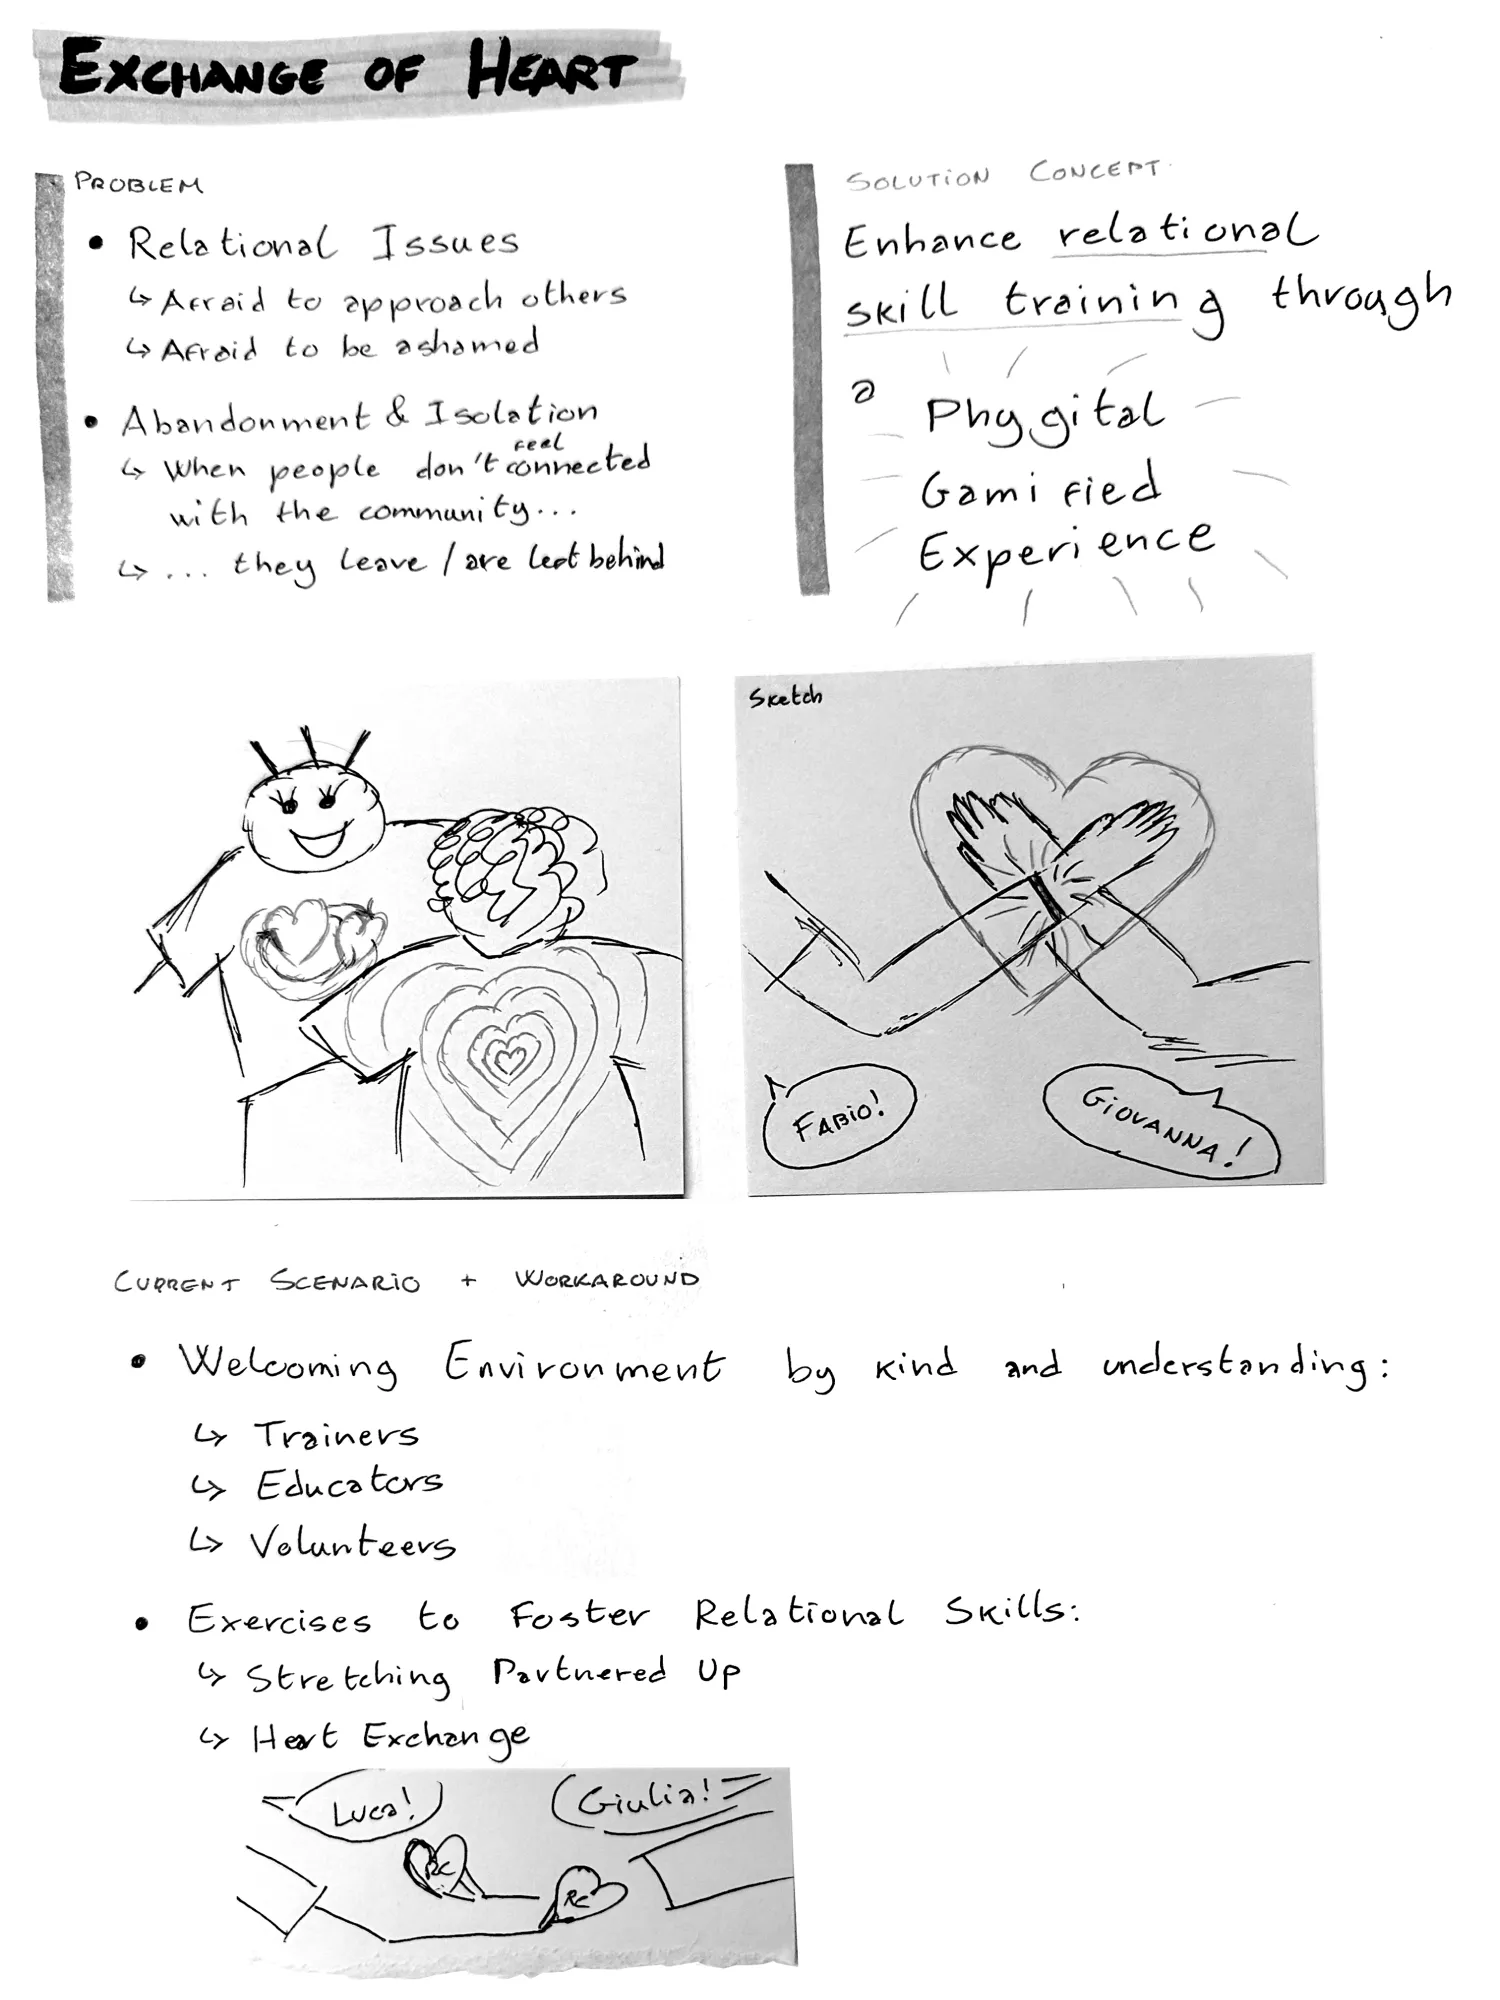
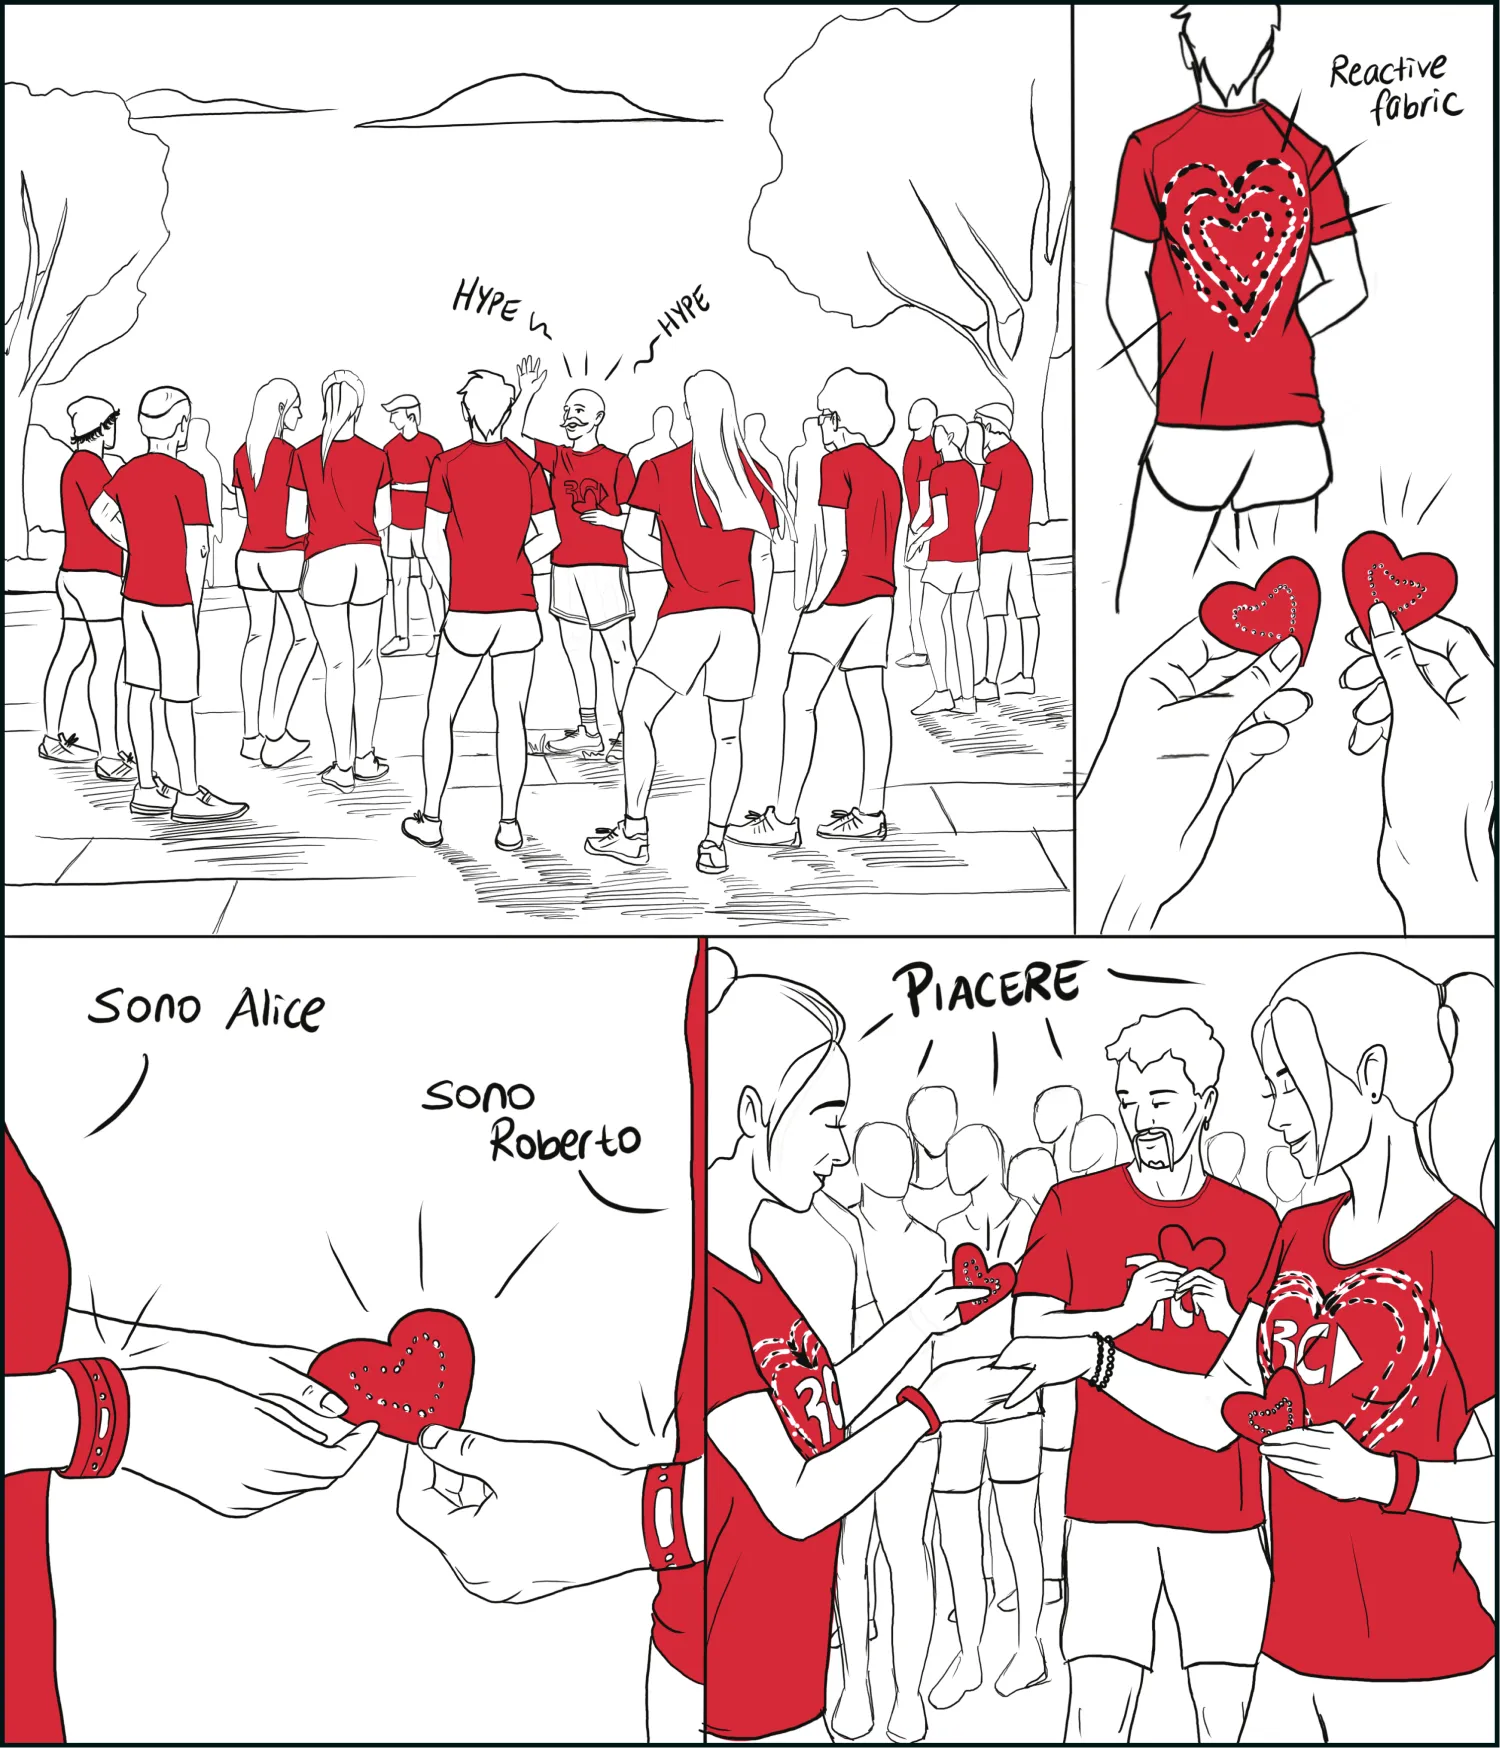
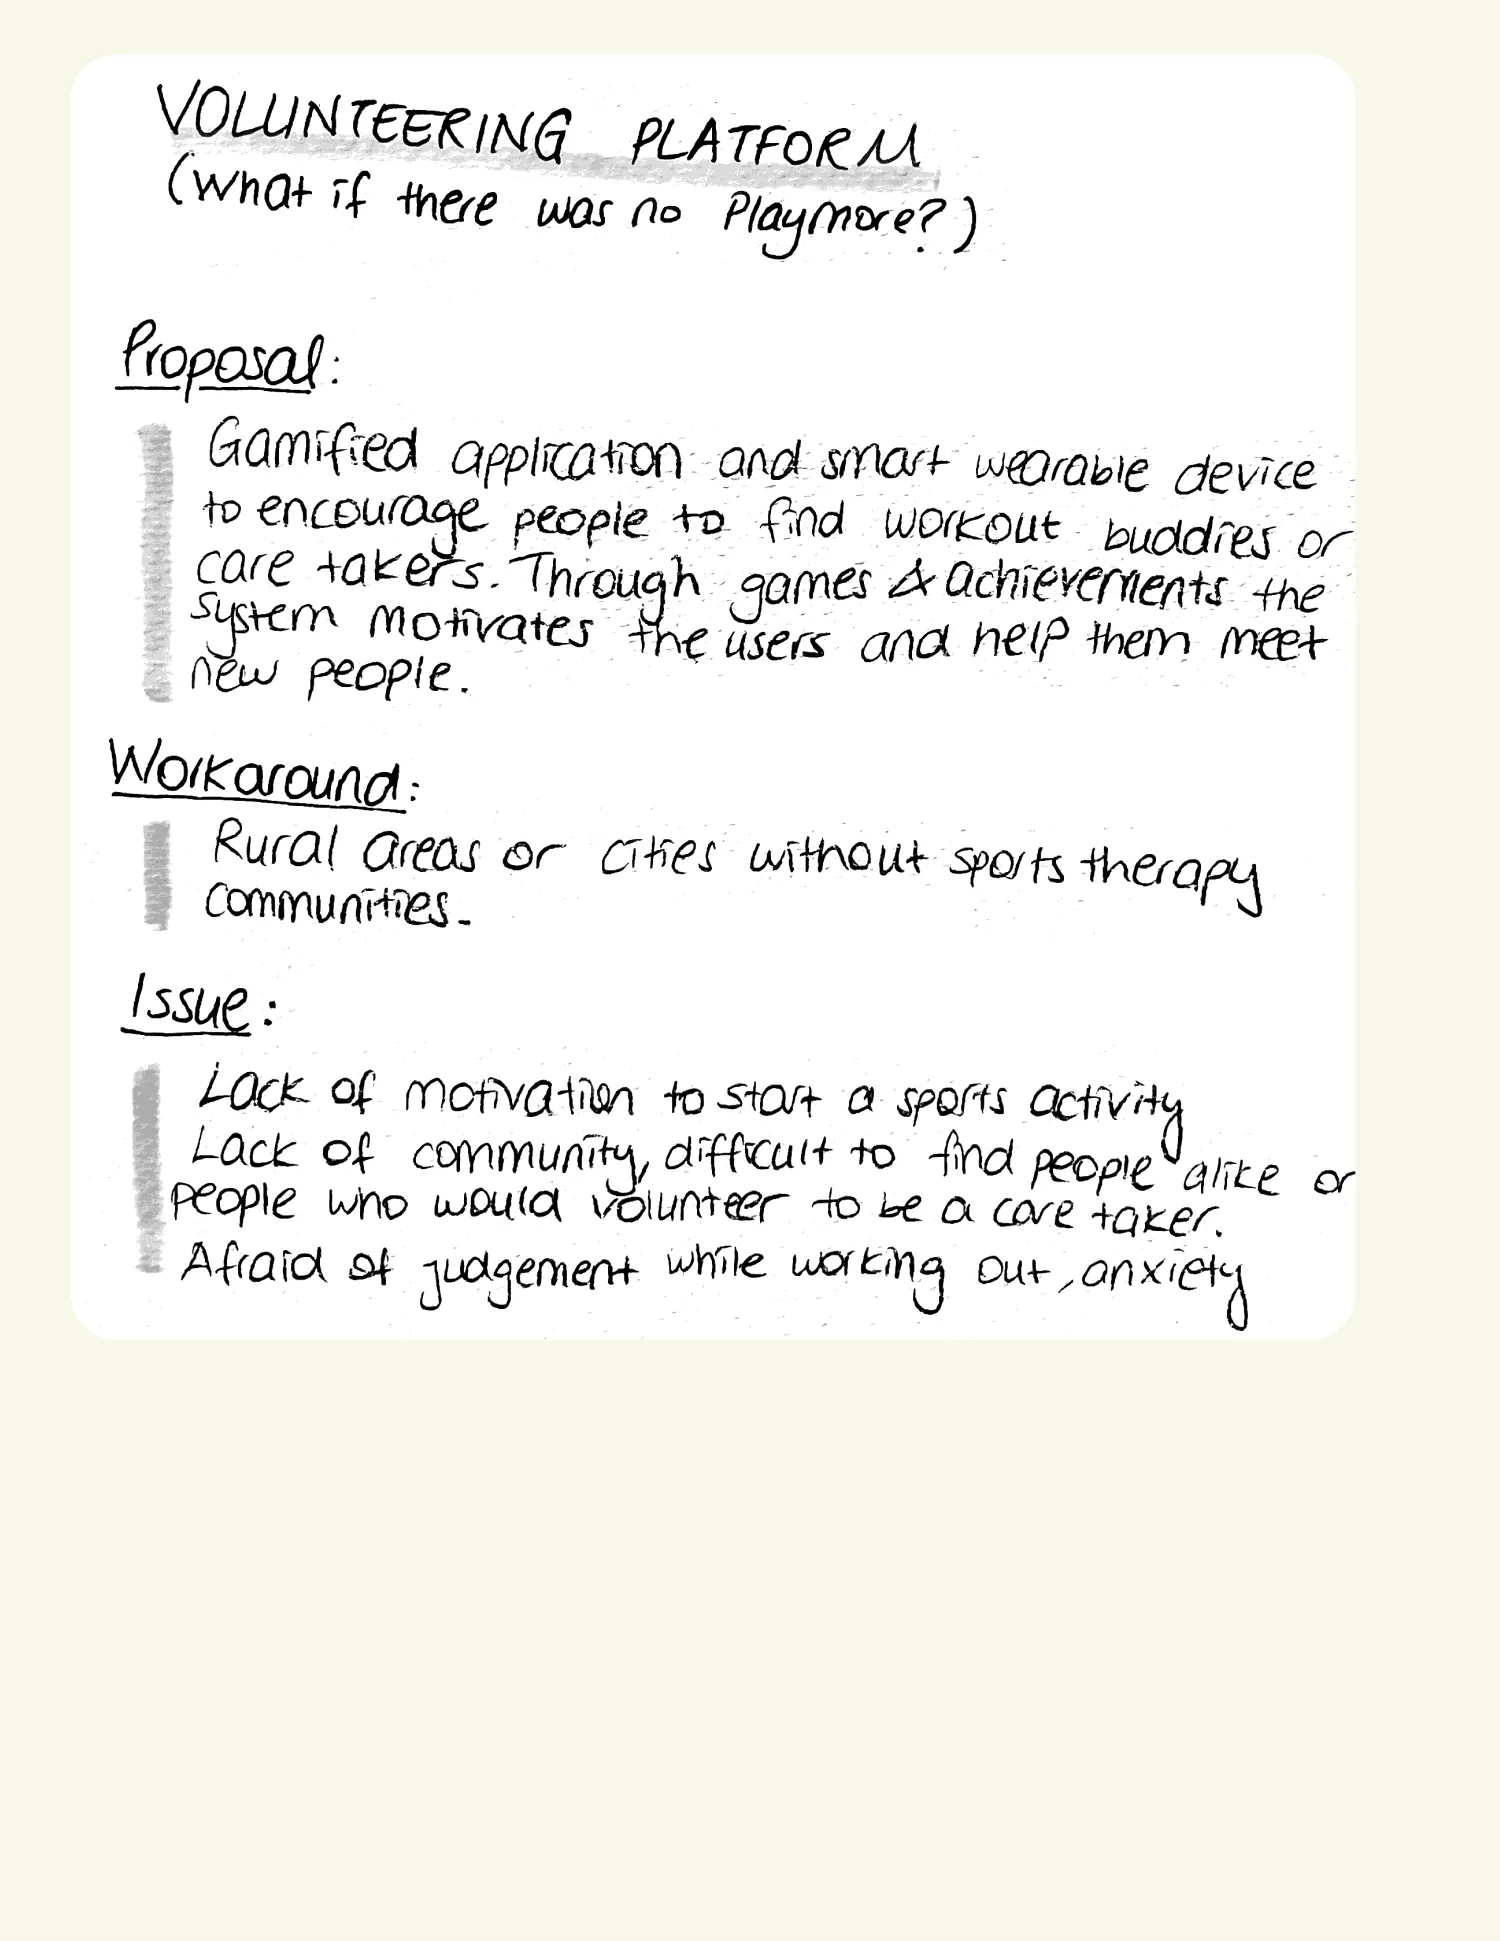
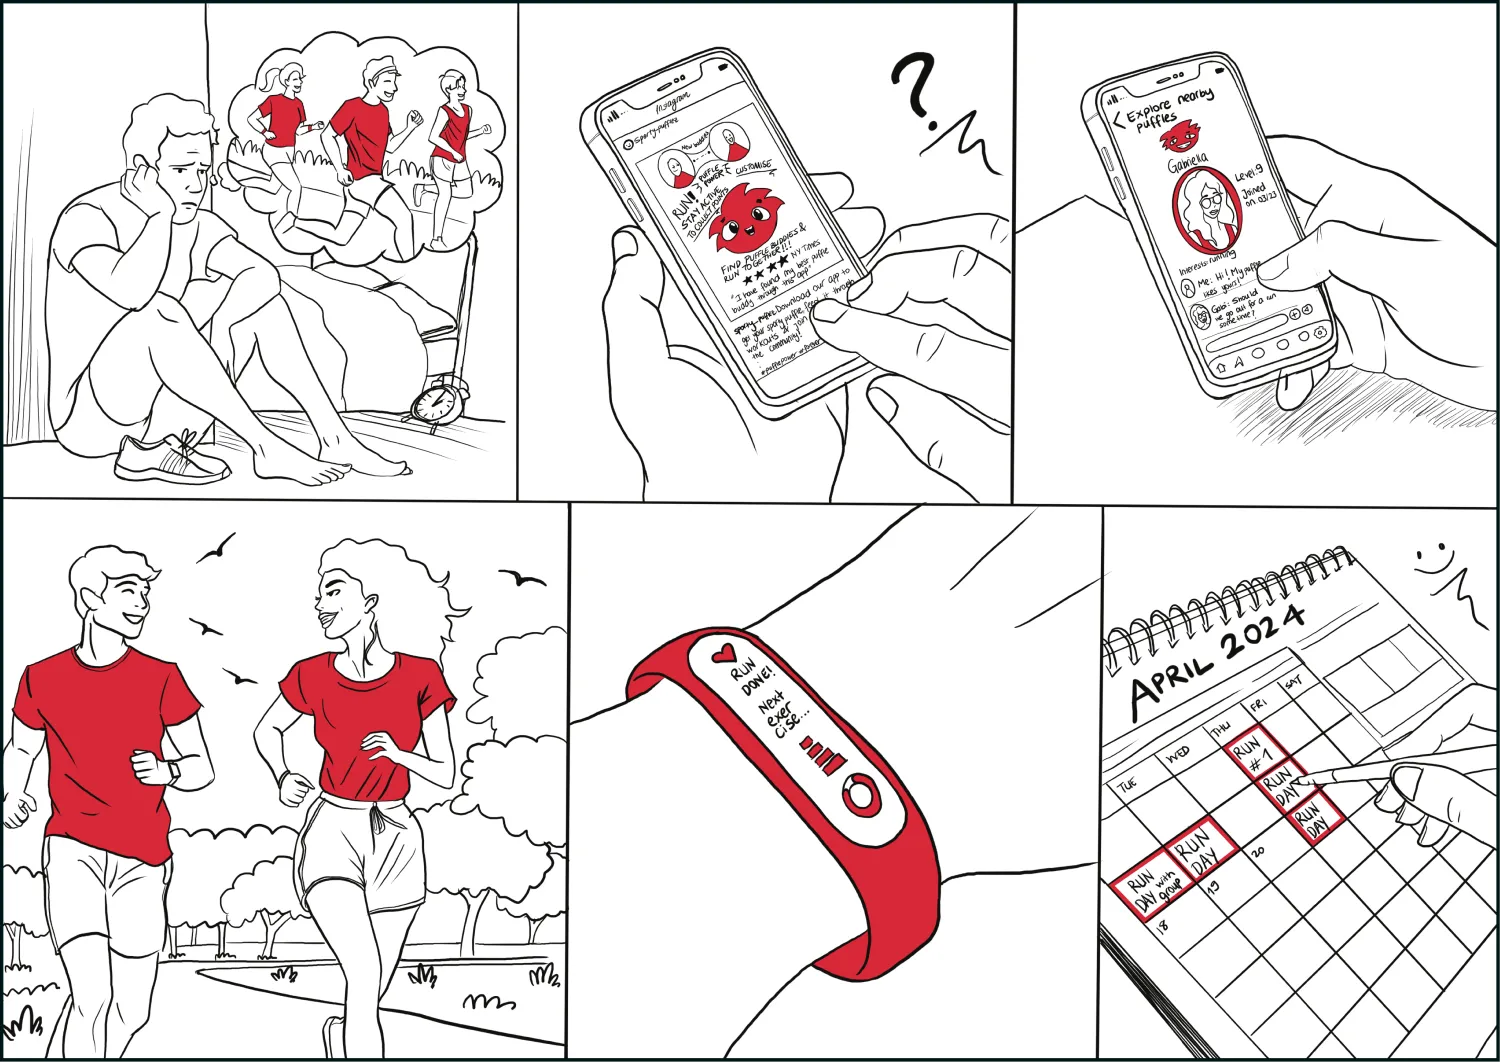
Fig 2.5 – The four preliminary concept ideas and storyboards
We received feedback regarding the first and second ideas being more useful and that we can combine them. However, through discussions, we realised integrating this technology into t-shirts, as stated in the second idea, would not be so feasible as the t-shirts would need to be washable. Instead, a smart band to be distributed to the runners can be a better option.
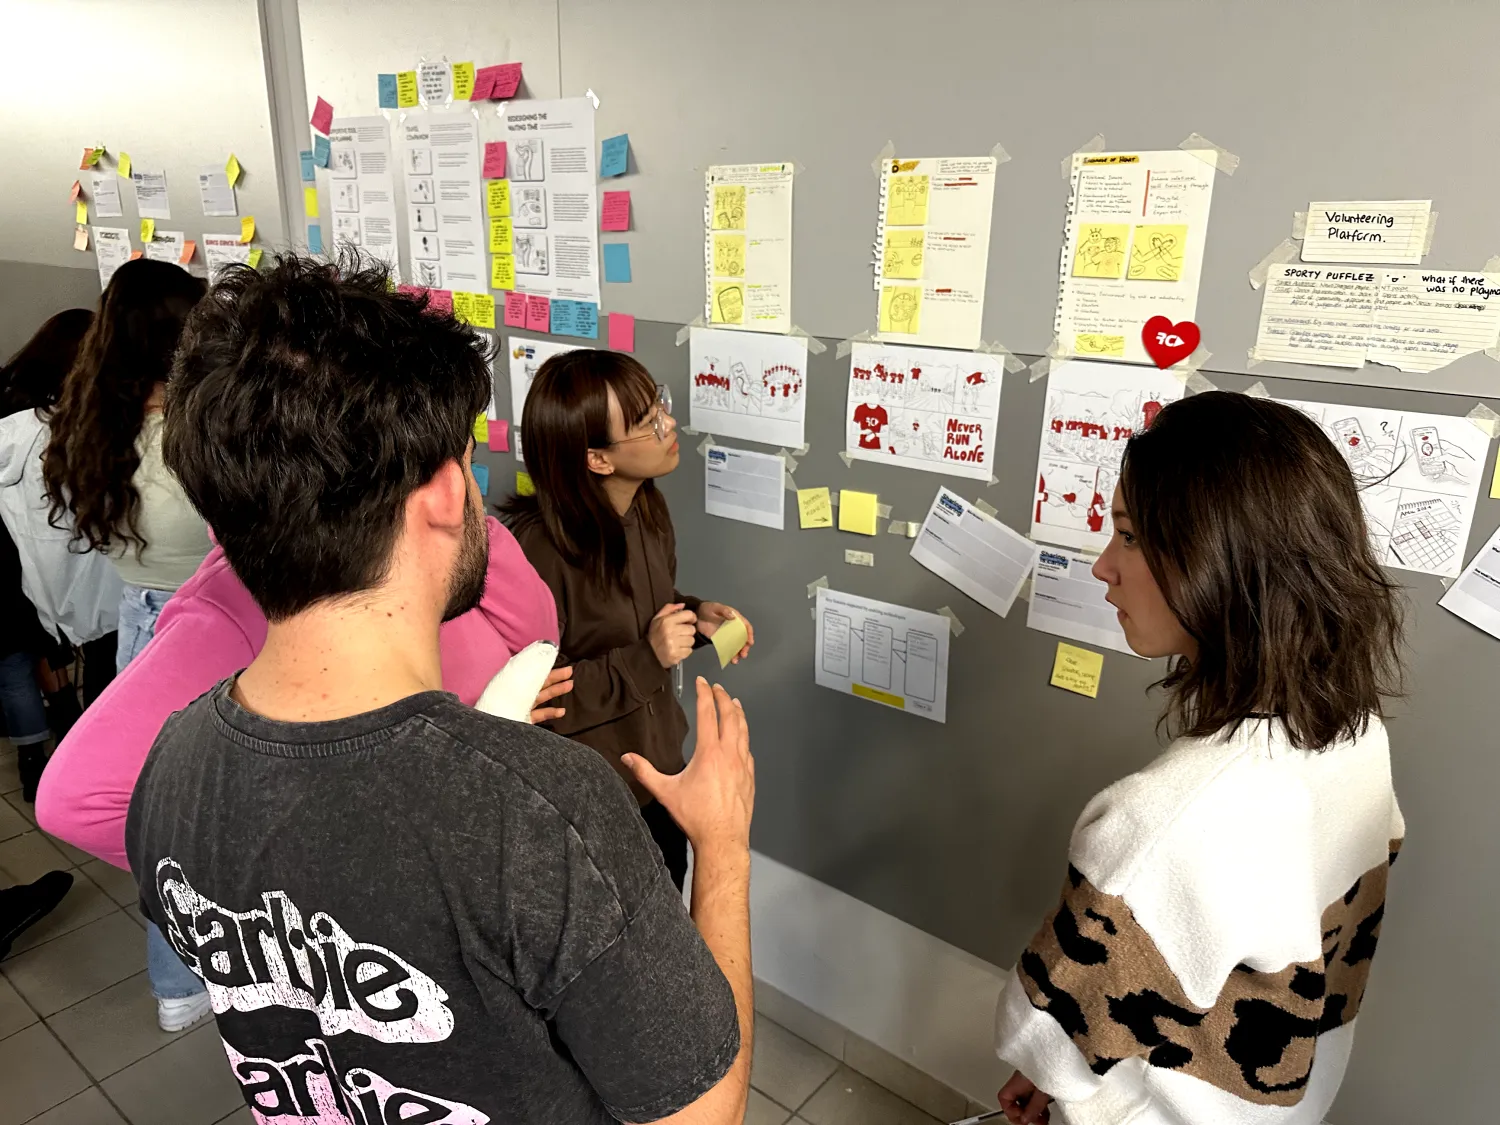 Fig 2.6 – Our peers commenting on the concept ideas
Concept development
In order to further develop our concept, we summarised how a combination of the first and second ideas could work, in a simple schema.
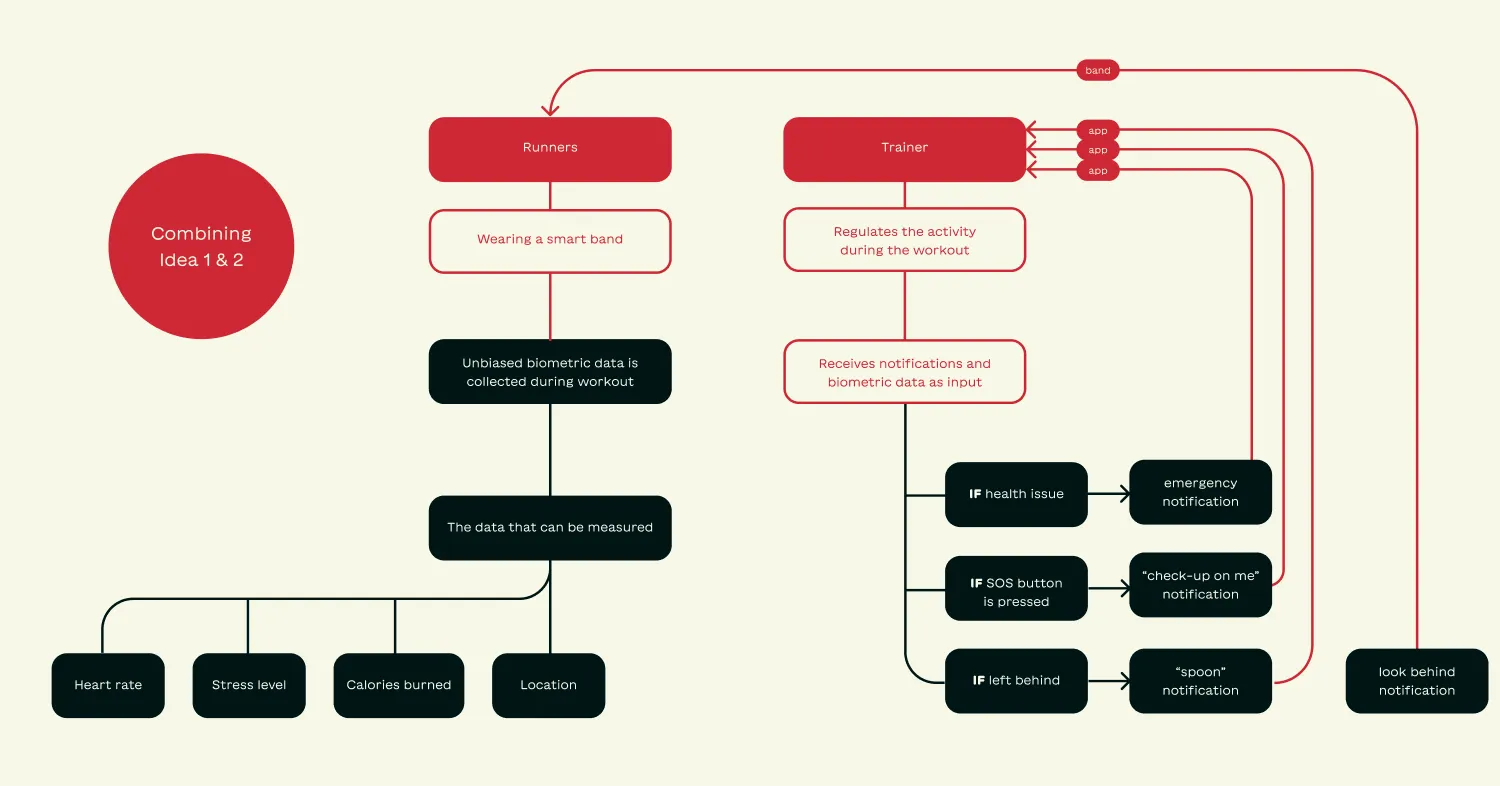 Fig 2.7 – Schema showing the working principle of the new idea
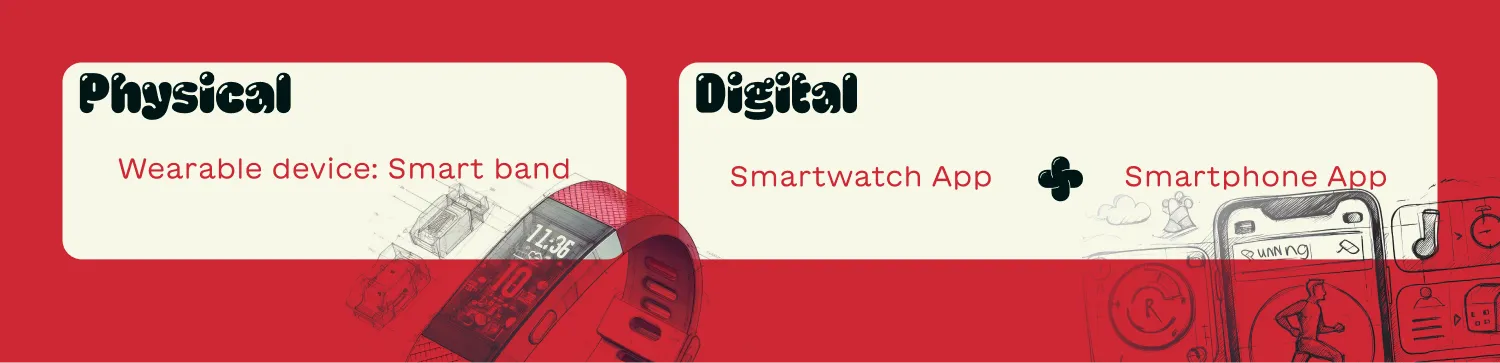 Fig 2.8 – Defining the physical and digital touchpoints
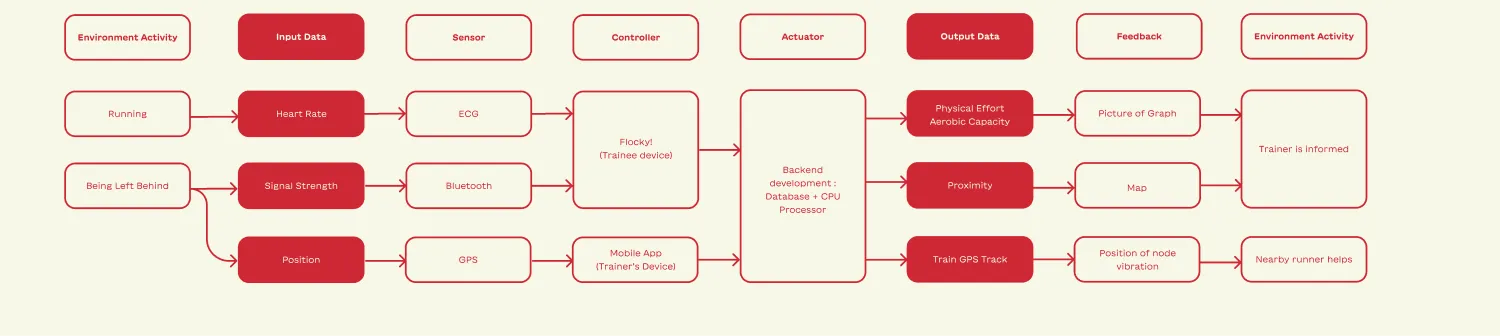 Fig 2.9 – Input-output mapping
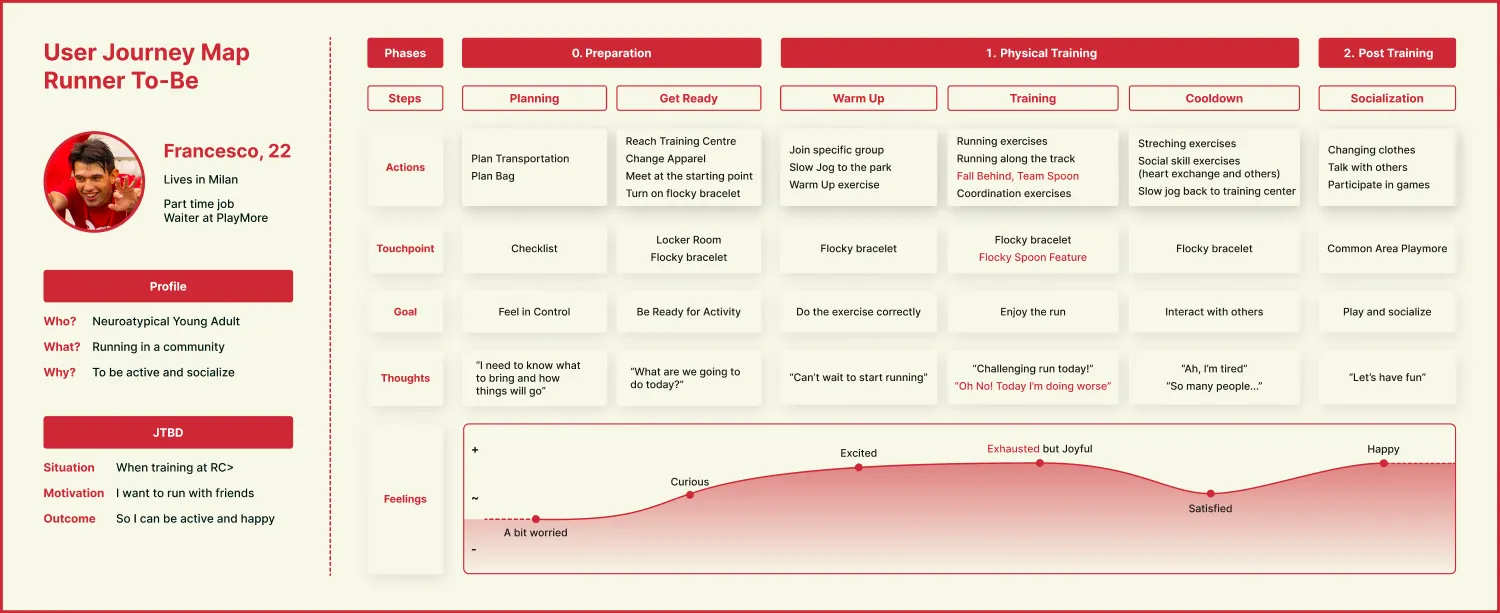 Fig 2.10 – User journey map of a runner using Flocky
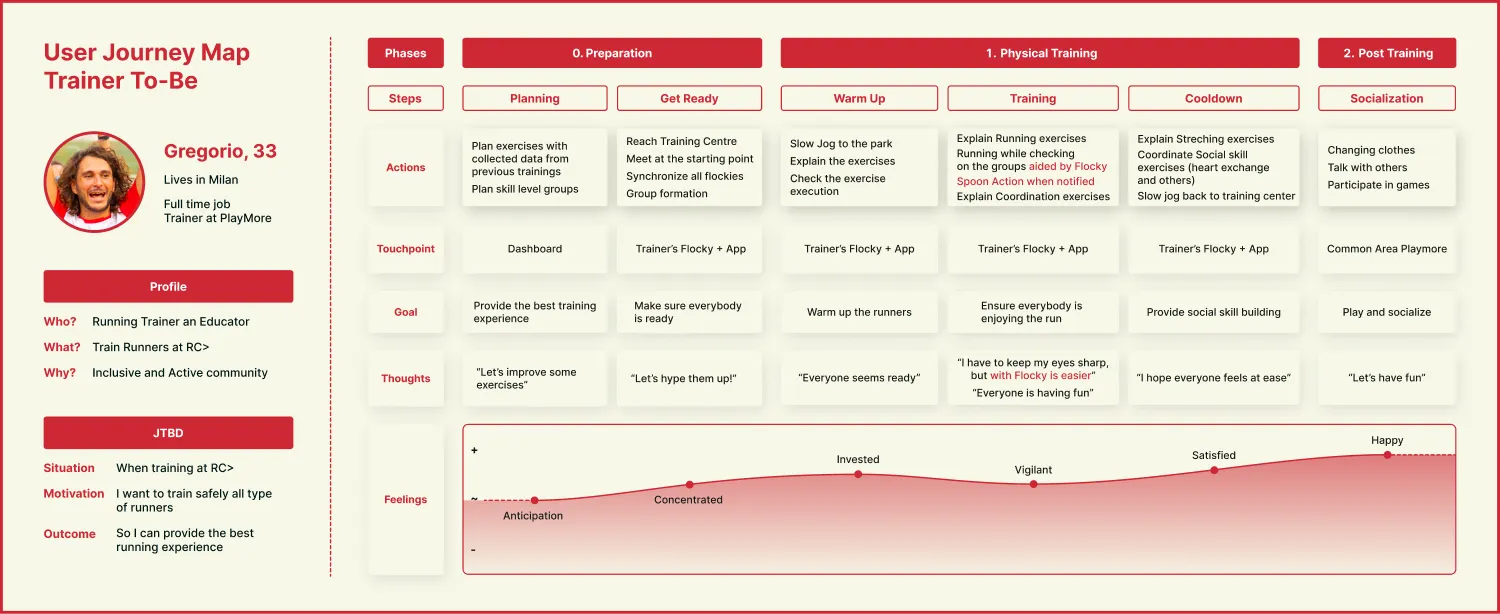 Fig 2.11 – User journey map of a trainer using Flocky
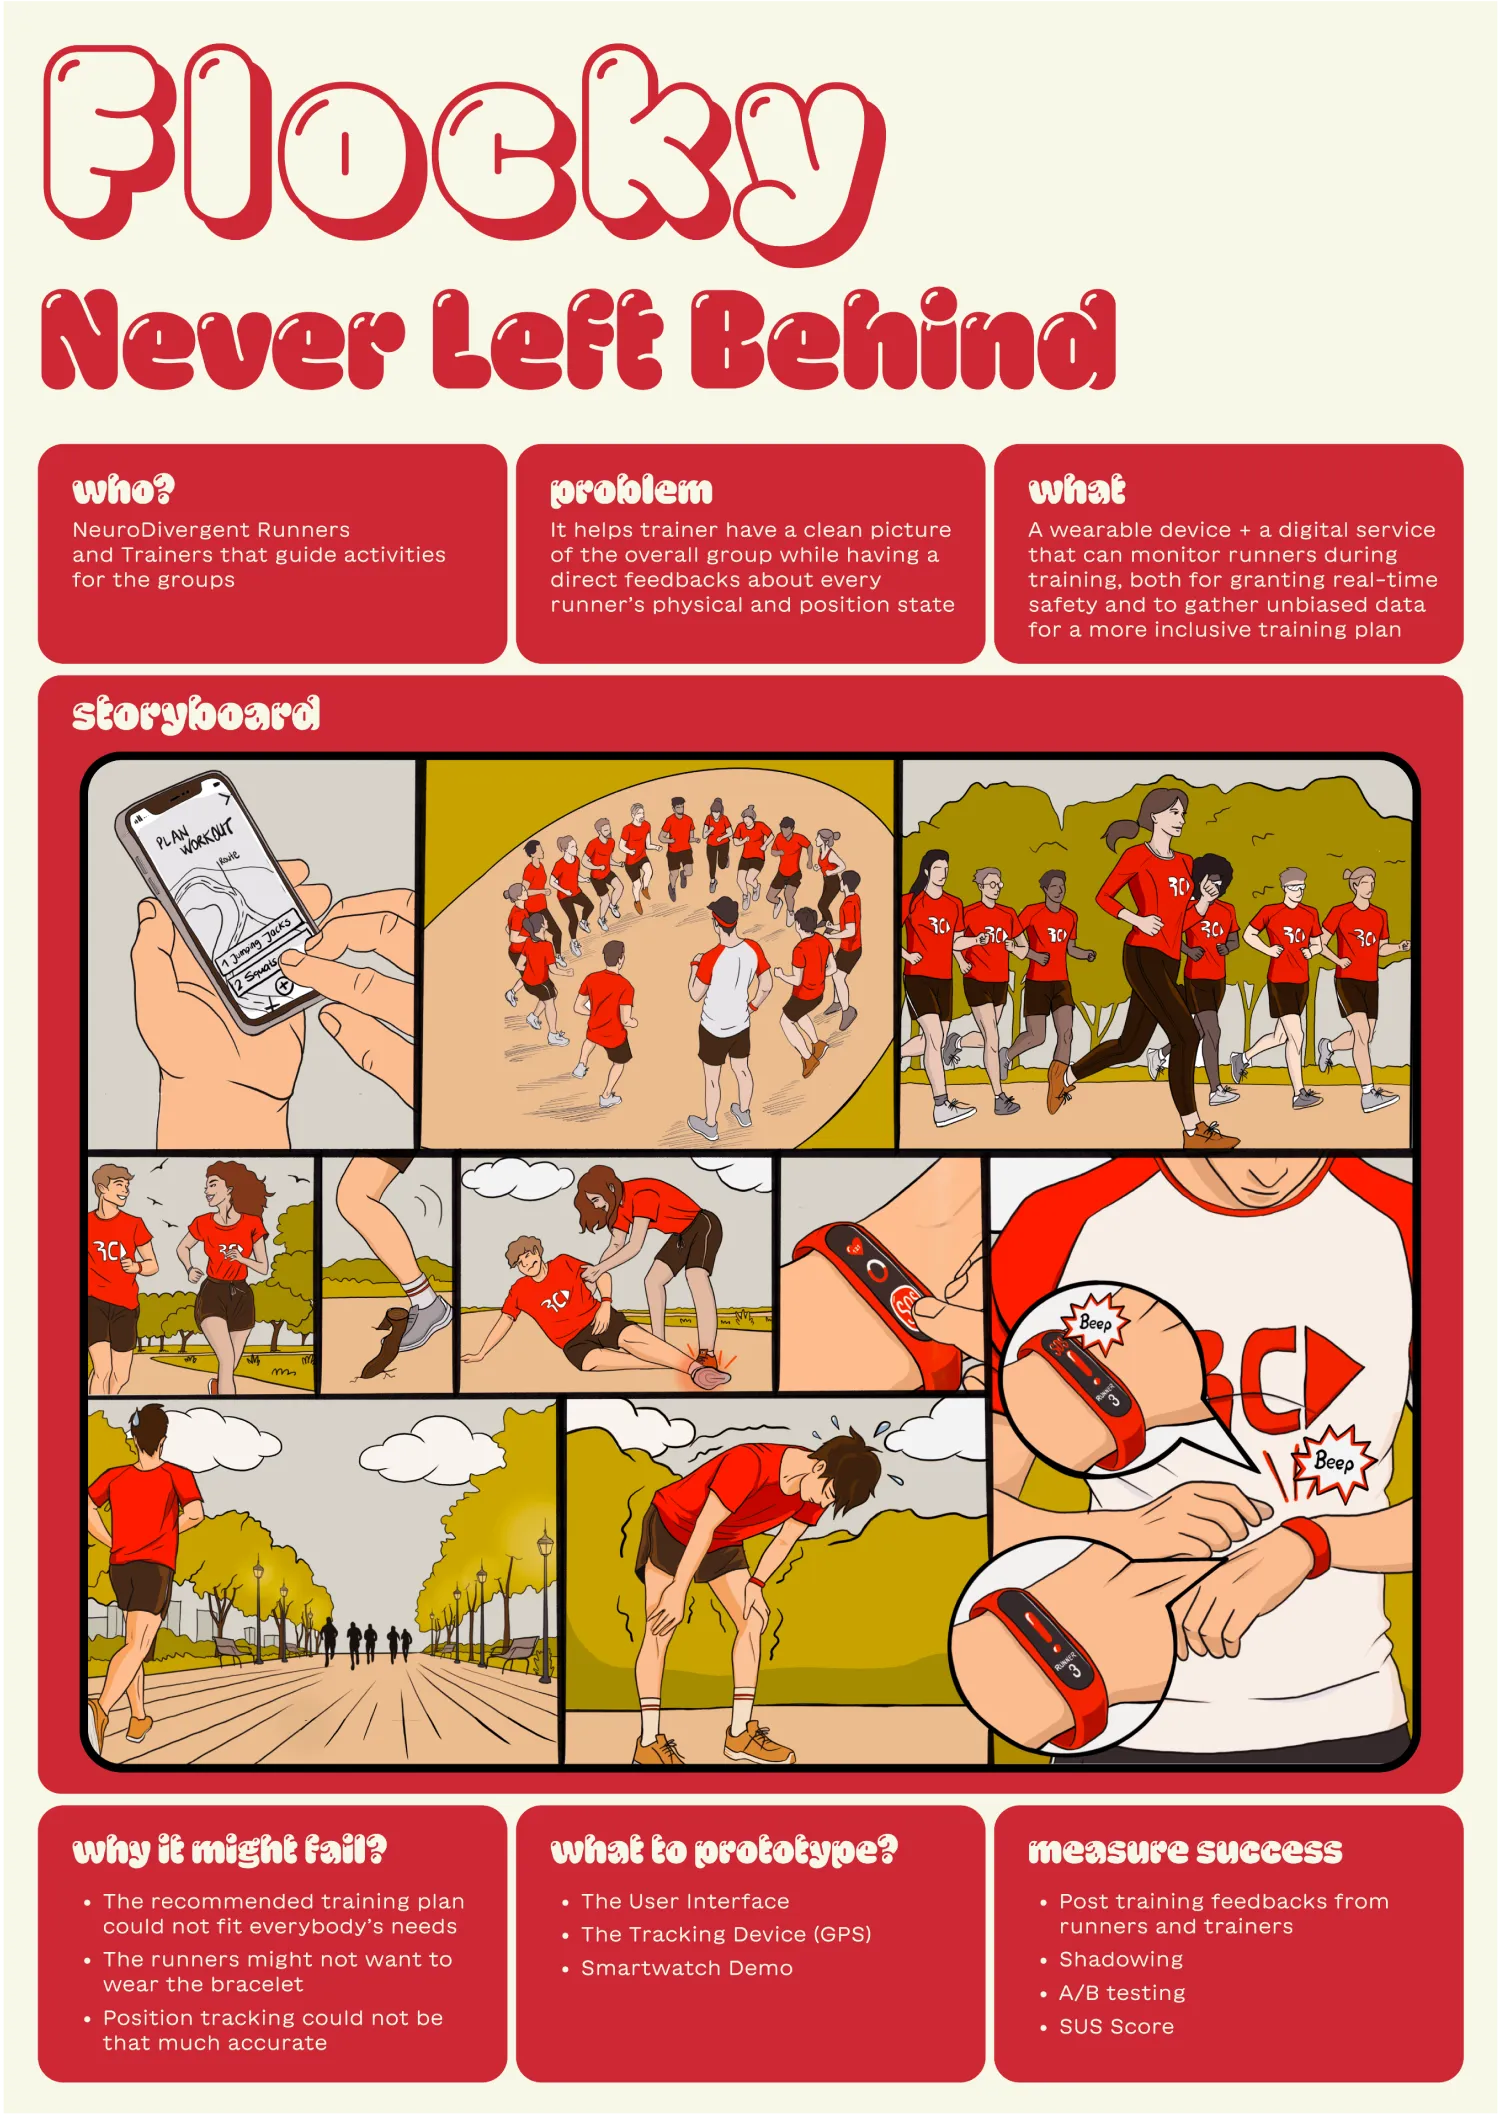 Fig 2.12 – First concept poster
After we formed our idea, we presented our design pitch to the head educator of Run Challenge Milan, Davide. We consulted about how the planning process works for the training and asked for any suggestions or comments to improve our concept, to suit our target audience better.
Davide provided us with valuable feedback and offered additional insights into the functioning of RunChallenge, which not only enhanced the meaning of our proposal but also clarified certain aspects.
One primary challenge they face is the necessity to gather data for sponsors and associations, demonstrating the effectiveness of their approach. They currently conduct “Fit Tests” to measure runner performances, manually recording the results in an Excel file, and then forwarding them to the associations. Flocky would cover this aspect automatically. Also through this conversation, we learned that associations and sponsors were also crucial stakeholders.
Davide also addressed the process of creating training plans, revealing that a designated professional, a “Super Coach,” forms the schedules for each group at the beginning of a season. This information helped us simplify our solution on the trainer’s end: as training plans are already established, the application would not need a function to form plans and would serve as a distributor.
Additionally, Davide expressed his current concerns about training sessions held in the dark, sometimes causing anxiety for both himself and the trainers.
He explicitly said that Flocky would be great to have in this situation, especially in smaller branches of Run Challenge (RC), with fewer staff members.
Lastly, we discussed our idea of having a Community feature in the application. Davide supported this idea and mentioned that as a widespread community, RC is in fact looking for a platform that could connect all the different branches, to facilitate communication, display updates, and organize co-running events.